You change the appearance of the data series in the chart with the Pen and Fill formatting buttons in the Tools window. You can also add data or change the data on which the chart is based.
Note: To change the color, pattern, or other attributes of the data plotted in the chart, you must use the chart legend. If you don't want a legend in your final chart, hide it.
To format plotted data:
1
Select the series box in the chart legend.
2
If the Tools window is not open, choose Show Tools from the Window menu, or click the toolbox icon at the bottom of the active document:
![]()
3
Select formatting options in the Tools window. For more details, see the formatting table below.
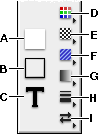
A
Fill
B
Pen
C
Text
D
Color
E
Pattern
F
Wallpaper
G
Gradient
H
Line Width
I
Arrow Style
If you don't see the chart legend:
Double-click the chart. In the Chart Options dialog box, select Labels, then click Legend. You can format the legend using the Chart Options dialog box.
| To format this type of chart |
Do this |
||||
| Pie, bar, pictogram | Use the Fill button to change fill color, pattern, wallpaper, or gradient. (For pictograms, Fill affects only the areas not covered by the picture.) | ||||
| Use the Pen button to change the border color, width, and pattern. | |||||
|
|
|||||
| Area, line, hi-low | Use the Pen button to change the line color, width, and pattern. | ||||
|
|
|||||
| Scatter | Use the Pen button to change the data point color, width, and pattern. | ||||
|
|
|||||
You can also format the chart data using the Accents window.
For more information about changing the way AppleWorks displays the data in a chart, see these topics:
Changing the symbols used to plot data
Changing chart pictogram symbols
Combining chart types in a single chart
Table of contents | Index