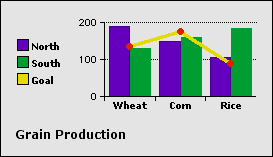
You can display different data series as different chart types in the same chart. For example, in a bar chart that shows monthly sales figures, you can display sales goals as a line.

You can combine bar, area, line, scatter, and pictogram charts. You create a combination chart by starting with one type of chart and then modifying specific data series.
To create a combination chart:
1
Select the chart, then choose Chart Options from the Edit menu.
Tip: You can also double-click a series box in the legend, if the chart has a legend.
2
If necessary, click Series.
3
Choose a data series from the "Edit series" pop-up menu.
4
Choose a chart type from the "Display as" pop-up menu.
Related topics
Table of contents | Index