You can add a chart title, legend, and data labels to a chart.
To format the text used in the chart title, legend, axis labels, or the text next to tick marks on the Y axis:
•
Select the text box in the chart and use the text formatting commands in the Format menu.
To format the division labels (the text next to tick marks on the X axis):
•
Select the text in the spreadsheet and use the text formatting commands in the Format menu.
The changes are reflected in the chart.
Tip: To add a drop shadow to the title text or legend text (as opposed to the box around the text), press the Command ![]() key while clicking the title. To change the light source that produces the shadow, press
key while clicking the title. To change the light source that produces the shadow, press ![]() -Shift while clicking the title.
-Shift while clicking the title.
To change the color or pattern of the text box border and background:
•
Select the title and use the Fill formatting button and Pen formatting button in the Tools window.
If the Tools window is not open, choose Show Tools from the Window menu.
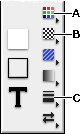
A
Color
B
Pattern
C
Line Weight
Tip: To remove the text box border, select the title, then click None in the Line Weight pop-up palette of the Tools window.
You can also format chart text using the Accents window.
You can also add descriptive text that is not part of a chart's components.
For more information about adding and formatting chart text, see these topics:
Adding and formatting a chart title
Adding and formatting a chart legend
Adding and formatting chart data labels
Table of contents | Index