Detaching a slice from a pie chart
To emphasize a slice in a pie chart, you can detach, or "explode," it from the rest of the pie.

To detach a pie slice:
1
Select the chart, then choose Chart Options from the Edit menu and click Series.
Tip: You can also double-click a series box in the legend, if the chart has a legend.
2
Choose the data series (the slice) you want to detach from the "Edit series" pop-up menu.
3
Select "Explode slice."
Tip: To detach a slice quickly, press the Option key and click a series box in the legend. Option-click again to reattach the slice.
Scaling multiple pie charts
You can scale pie charts to reflect the relative sizes of the data divisions. For example, if the values of the first division add up to 100 and the values of the second division add up to 200, you can display the first-division pie at half the size of the second-division pie.

To scale multiple pie charts:
1
Select the chart, then choose Chart Options from the Edit menu.
Tip: You can also double-click the chart.
2
If necessary, click Gallery.
3
Select "Scale multiple."
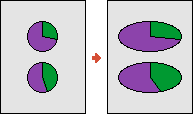
Tilting pie charts
You can tilt pie charts for a different effect and to fit more pies into the same area.

To tilt a pie chart:
1
Select the chart, then choose Chart Options from the Edit menu.
Tip: You can also double-click the chart.
2
If necessary, click Gallery.
3
Select Tilt.
Related topics
Table of contents | Index