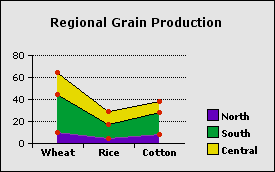
An area chart (also called a layer chart) represents data by plotting a data series on a line and shading the area below the line. In a stacked area chart, the data series within each division are plotted as cumulative totals and stacked on top of one another.

The chart above shows three data series. The values for the first division (Wheat) are 10, 35, and 20. The first data point in the division is plotted as 10, the second as 45 (the sum of the first two values), and the third as 65 (the sum of all three values).
Related topic
Table of contents | Index